
How Brew & Buzz Scaled Kaka Halwai Sweets & Namkeen's Instagram Reach 274% in a Single Month
An Instagram growth case study covering the December 2024–February 2025 period, built around a Sankranti seasonal campaign and a paid-amplification push.
About the Author
Key Takeaways
Instagram reach on KHSN's primary tracked account grew from 27,400 to 102,500 between January and February — a +274.09% increase in a single month.
The growth was paid-media led, not organic: ads-driven views rose from 2,093 in December to 124,080 in February, while organic views stayed roughly flat.
A festival-specific campaign (Sankranti, run in January) preceded the February scale-up, alongside a shift toward more Instagram Stories and fewer static posts.
The brand's Google Business Profile drew over 11,000 monthly search impressions in the same window, with “kaka halwai near me” as the top-converting search term — included here as a transparency check on local visibility, not as a website SEO ranking.
Methodology & Data Sources
This report draws on seven tabs inside a single client-supplied workbook: “3 Months Report IG,” “3 Months Report FB,” “LinkedIn,” “Facebook,” “KHSN Instagram Comparison,” “Google Analytics,” and “Google Reviews.” Beyond the visible cell data, the workbook contains embedded screenshots from Instagram/Facebook's native analytics and from the Google Business Profile dashboard — these were opened and read directly to source the top-content and local-search figures cited below, rather than summarized secondhand.
- Instagram performance: read from the “3 Months Report IG” tab's Dec–Feb data rows, plus its embedded “Most Reached Reels” screenshots
- Facebook performance: read from the “3 Months Report FB” tab and its embedded top-content screenshots; a conflicting secondary “Facebook” tab is disclosed separately below
- LinkedIn performance: read from the “LinkedIn” tab
- Local search visibility: read from Google Business Profile screenshots embedded in the “Google Analytics” tab, covering Aug–Nov 2024
- Multi-account context: read from the “KHSN Instagram Comparison” tab
No data from outside this workbook (no Google Search Console, ad-platform exports, or web analytics) was used or assumed.
About Kaka Halwai Sweets & Namkeen
Kaka Halwai Sweets and Namkeen (KHSN) is a Pune-based sweets and namkeen brand operating multiple retail branches across the city, including Aundh, Budhwar Peth, Navi Peth, Manjiri, Model Colony, Fatima Nagar, Warje, Satara Road, Pimple Nilakh, Baner, Kalewadi, and Pimple Gurav. The brand maintains five distinct active Instagram accounts tied to different store clusters.
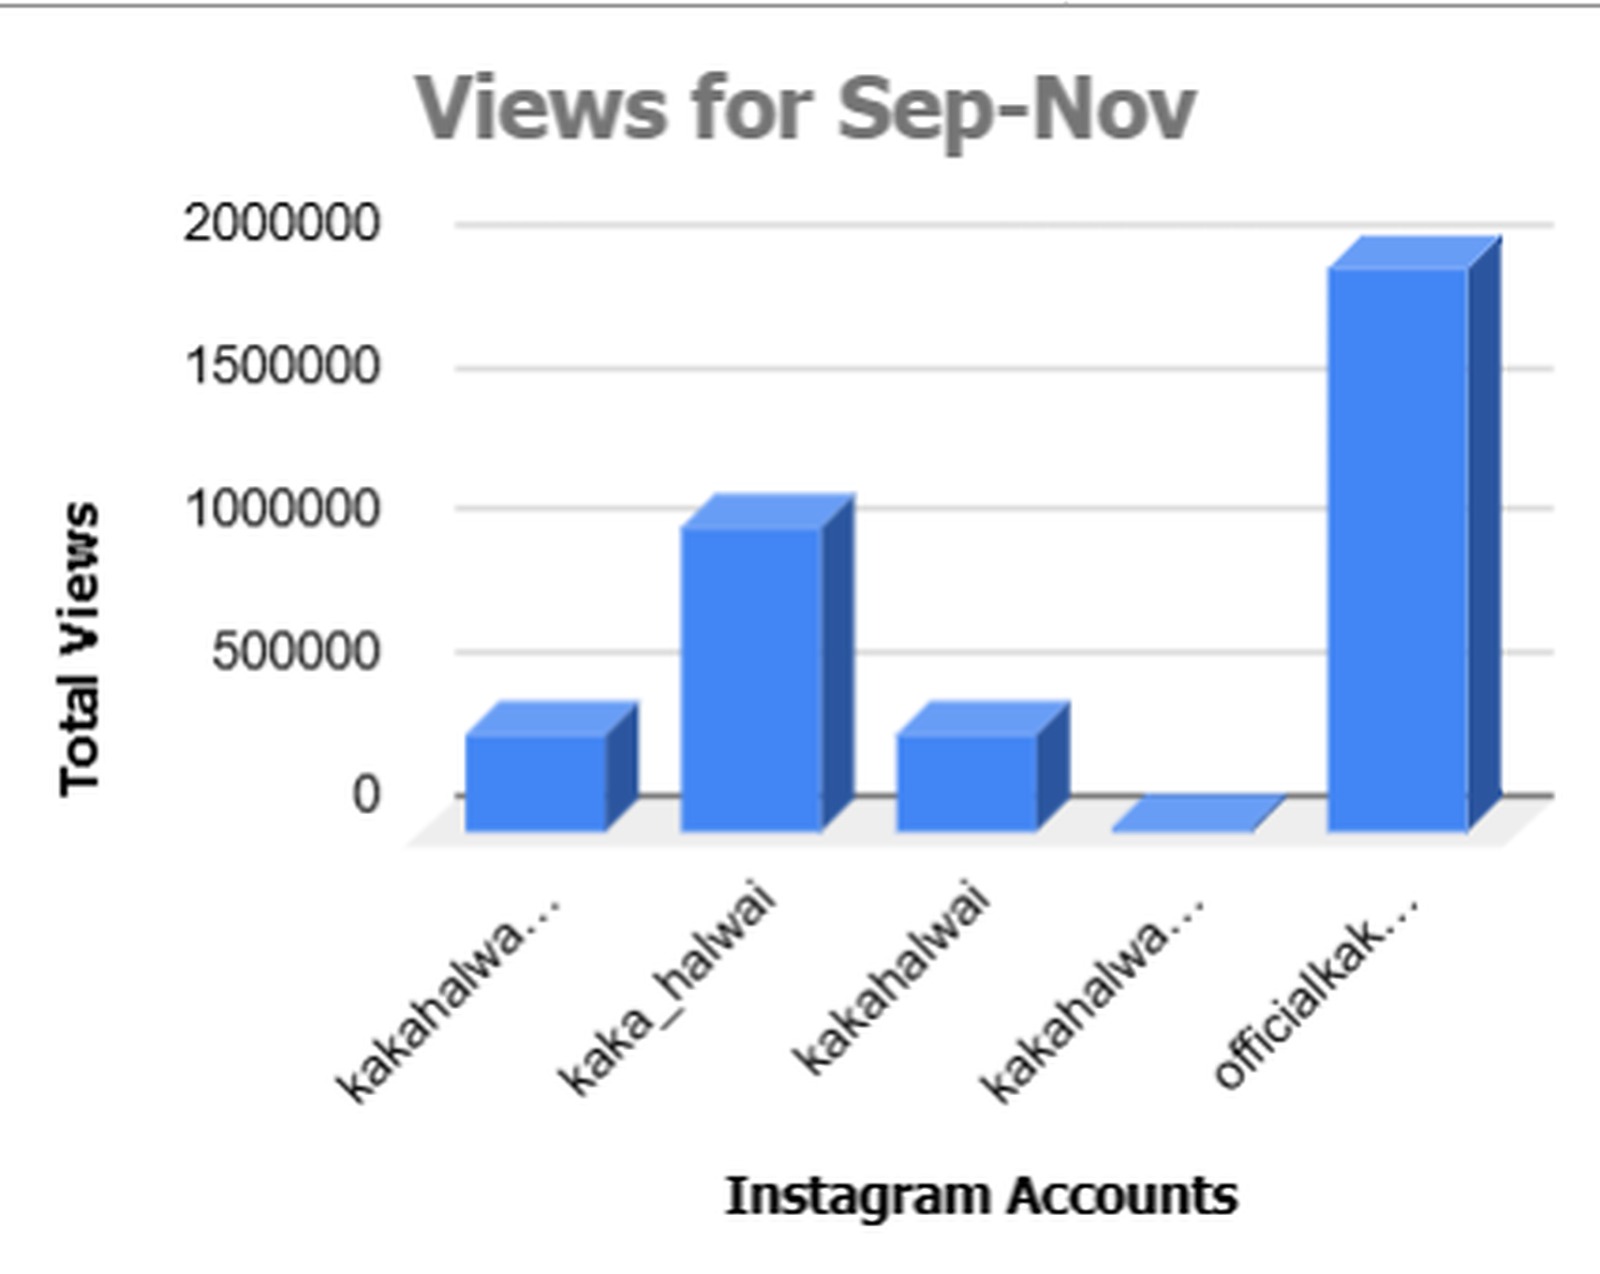
Views for Sep–Nov across KHSN's five Instagram handles
| Instagram handle | Associated stores | Followers |
|---|---|---|
| kakahalwai_sweetsandnamkeens | Aundh & Budhwar Peth, etc. | 681 |
| kaka_halwai | — | 2,937 |
| kakahalwai | Sweet Center | 1,936 |
| kakahalwaisweets | Navi Peth, Manjiri, Model Colony | 1,348 |
| officialkakahalwaisweets | Fatima Nagar, Warje, Satara Road | 3,784 |
Instagram accounts data
Per the client's Instagram-comparison tracking, each handle's 3-month performance (reels posted, total views, number of posts) looked like this over the same broader window:
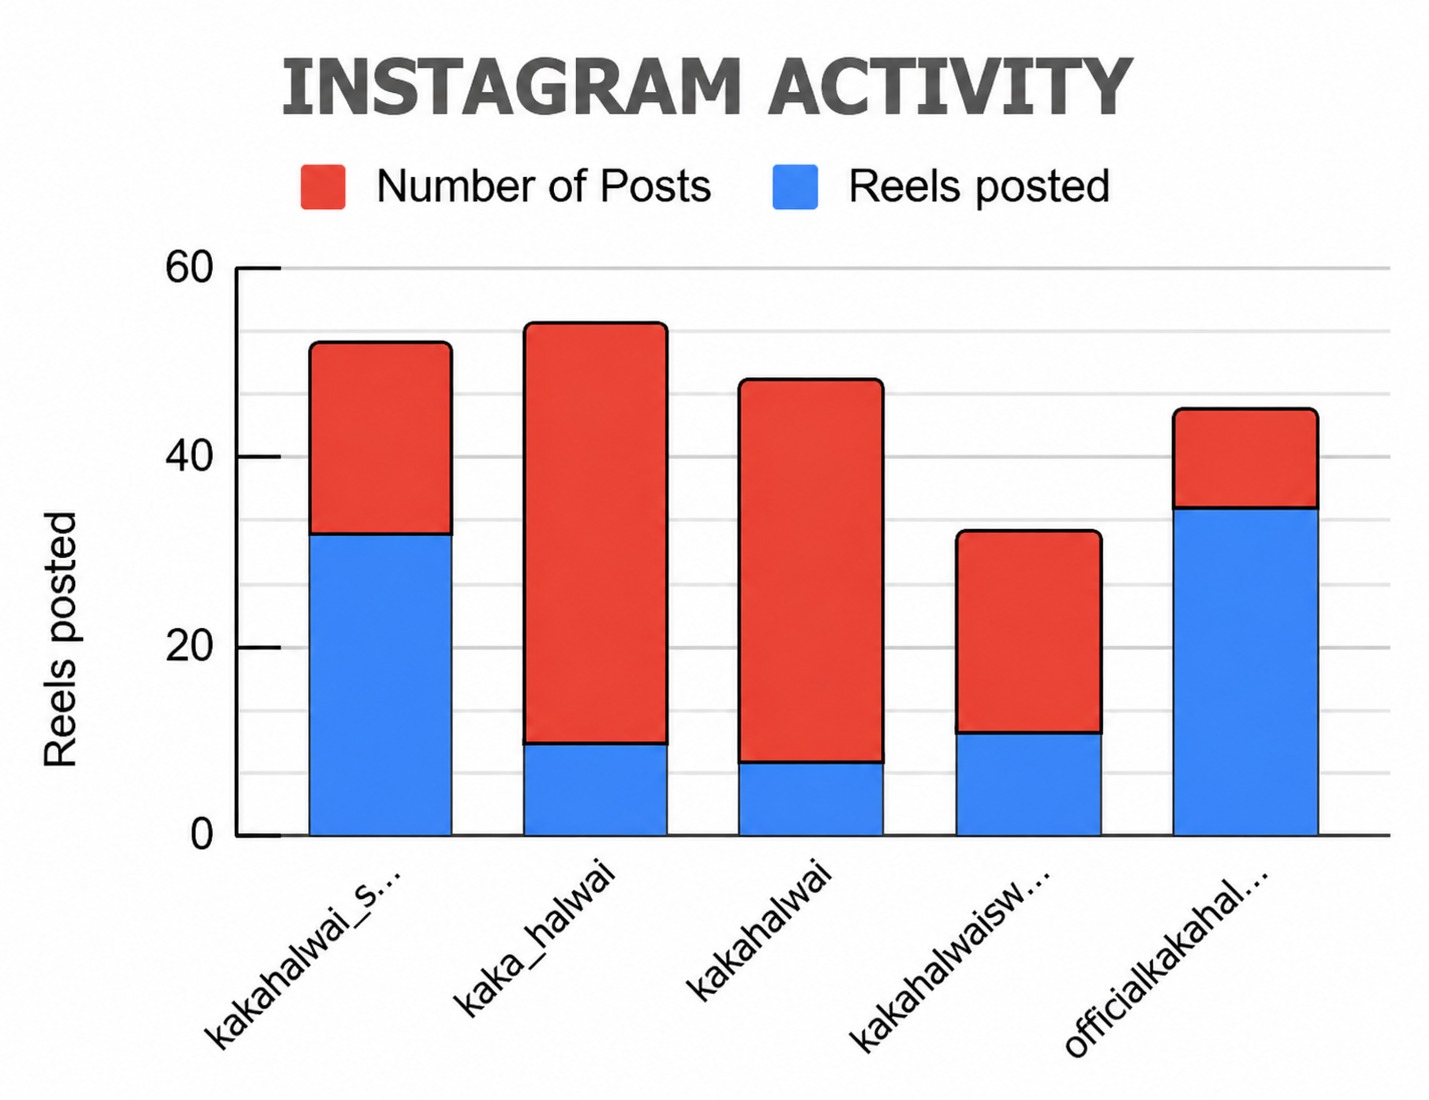
Instagram activity — reels posted vs. total posts per handle
| Instagram handle | Reels posted | Total views (3-mo.) | No. of posts |
|---|---|---|---|
| kakahalwai_sweetsandnamkeens | 32 | 335,179 | 20 |
| kaka_halwai | 10 | 1,063,366 | 44 |
| kakahalwai | 8 | 339,132 | 40 |
| kakahalwaisweets | 11 | 11,421 | 21 |
| officialkakahalwaisweets | 35 | 1,953,201 | 10 |
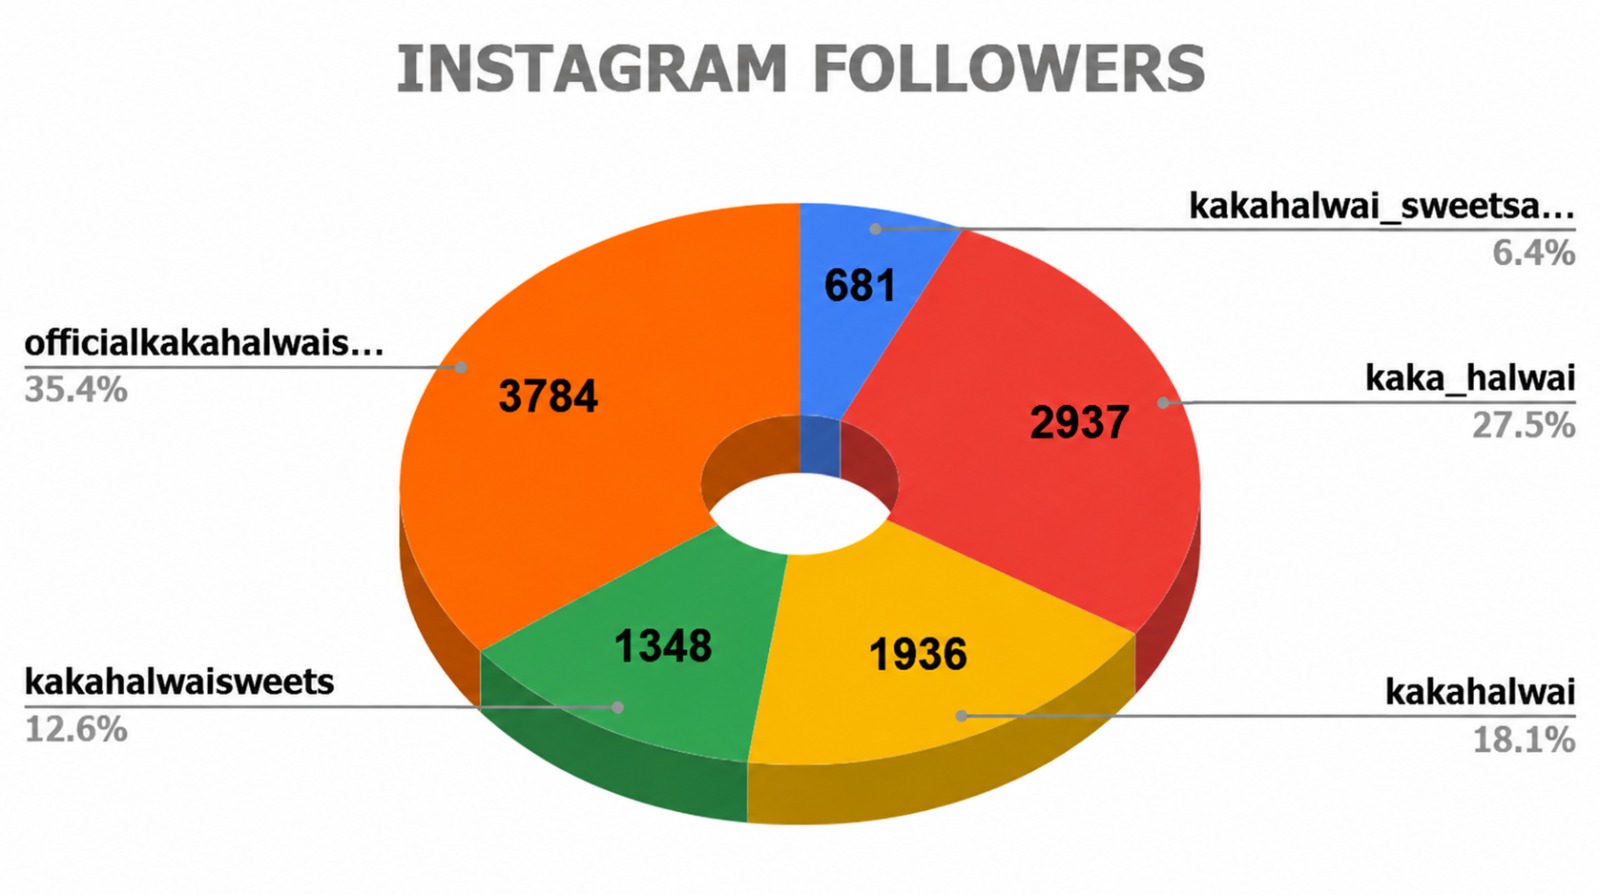
Instagram Followers growth chart
The Starting Point
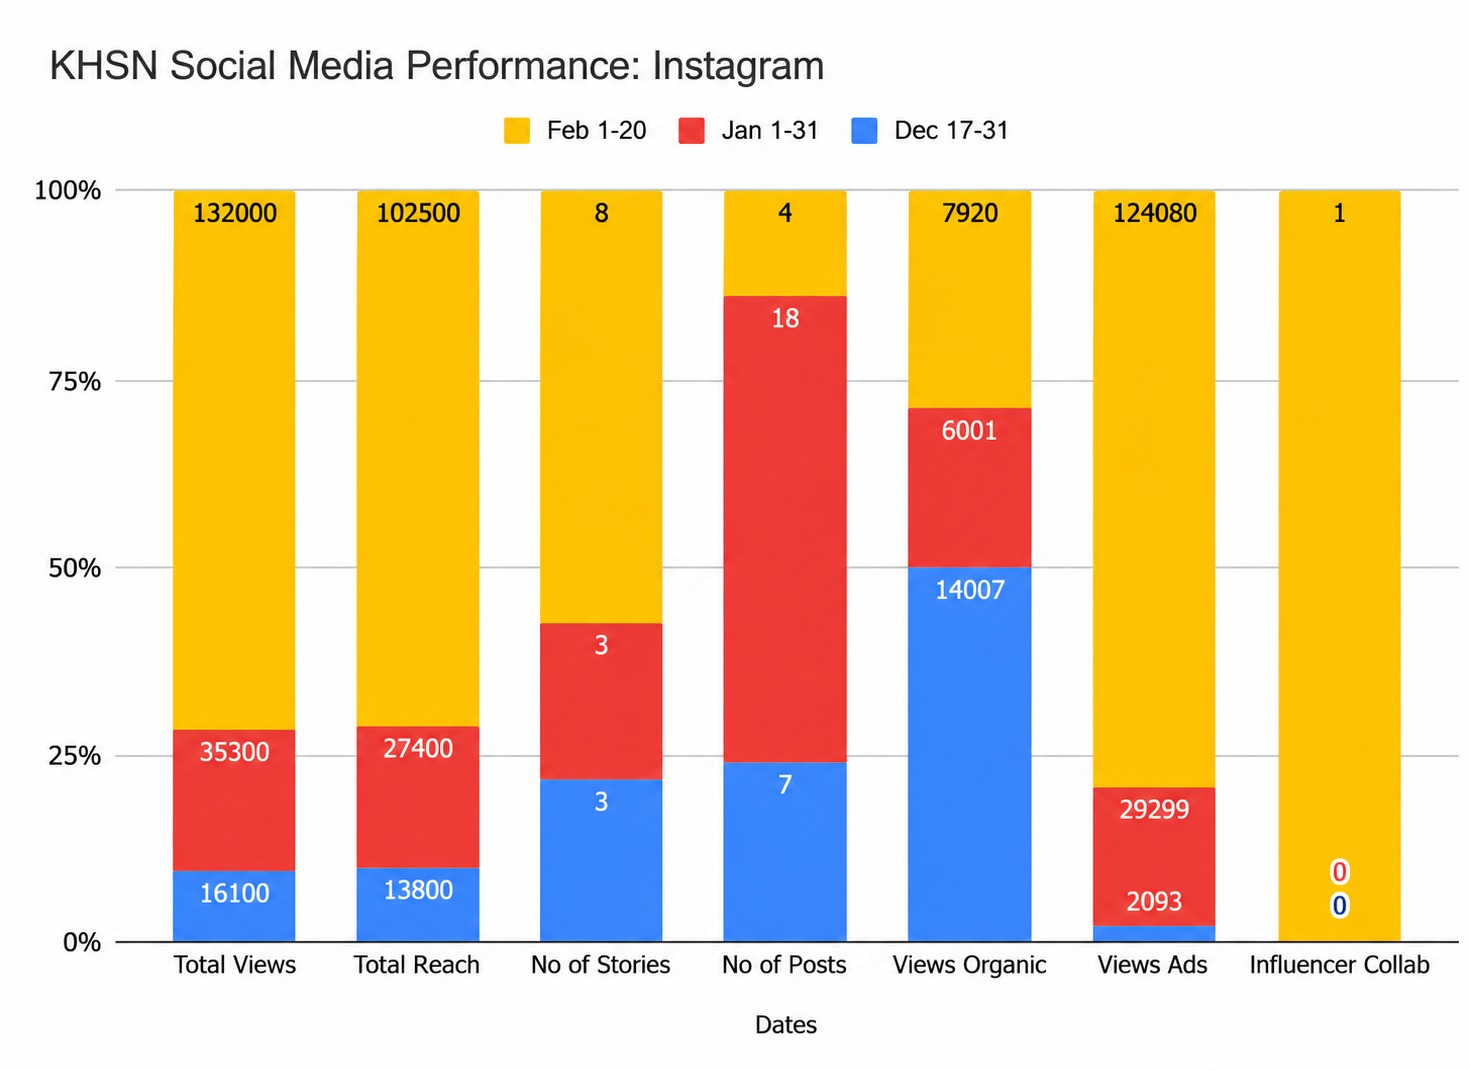
Kaka Halwai Instagram performance growth (Dec–Feb, all tracked metrics)
- A December baseline of 16,100 Instagram views and 13,800 reach on the primary account — modest for a multi-branch retail brand
- Content that was almost entirely organic in December (14,007 of 16,100 views, ≈87%, came from organic reach; only 2,093 views came from ads)
- A thin Stories cadence (3 Stories in both December and January) alongside inconsistent posting volume (7 posts in December, jumping to 18 in January)
- Brand presence split across five separate Instagram handles by store cluster, performing very unevenly per the comparison data above
The Brew & Buzz Approach: Step by Step
Build a seasonal campaign around Sankranti (January)
January was run as a distinct “Sankranti” campaign rather than the “General” content used in December and February. The content built around this window leaned into festival-specific products:
- A dedicated Til (sesame) product range post — “Here's our wide range of Til products” covering Til Wadi, Til Gajak, Naram Til Ladoo, and Til Revadi (Jan 12)
- A Kaju-Strawberry Burfi feature post (Jan 14)
- A store-locator / engagement post — “Wait...choose! Main stores: Aundh and…” — which became the month's top performer at 28.6K views and 49 likes (Jan 21)
January social media campaign — December/January post performance screenshots
Shift the content mix from posts toward Stories
Stories held flat at 3 in December and January, then jumped to 8 in February (+166.67% month-over-month), while static/reel posts dropped from 18 in January to 4 in February (−77.78%). This is a clear format reallocation — fewer standalone posts, more Stories-driven touchpoints — timed to the same month the paid push scaled up.
Scale paid amplification sharply in February
Social Media Performance Chart — Total Views share by month
The single biggest driver of the month's growth was paid media. Ads-driven views moved from 2,093 in December, to 29,299 in January (+1,299.86%), to 124,080 in February (+323.50%) — meaning paid views alone in February exceeded the entire account's total views in December by more than 7x.
February Social Media Campaign Performance — top reels for the month
Introduce an influencer collaboration
February recorded the account's first influencer collaboration in the tracked period (0 in December and January, 1 in February), coinciding with the month's largest reach jump.
Reinforce trust with social-proof and milestone content
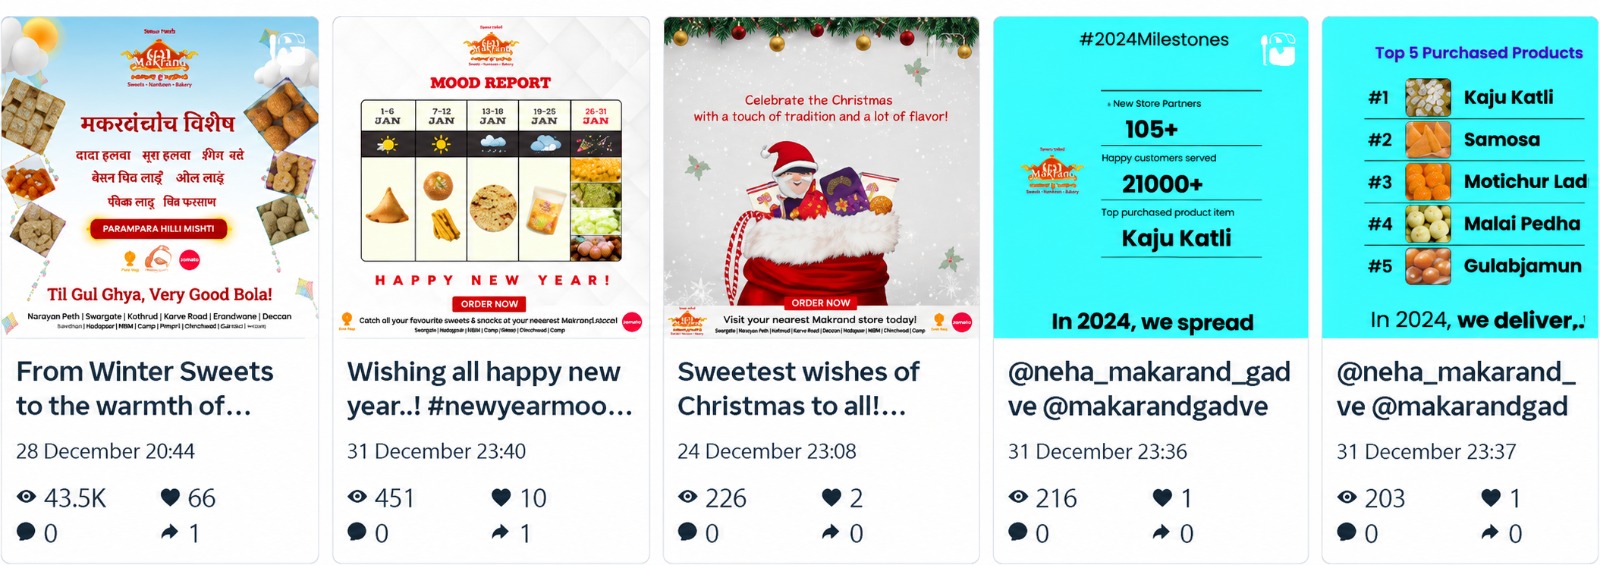
December content included a “2024 Milestones” post citing 105+ five-star reviews and 21,000+ total deliveries, with Kaju Katli named the most-purchased item, alongside a companion “Top 5 Purchased Products” post (Kaju Katli, Samosa, Motichur Ladoo, Malai Peda, Gulab Jamun). This kind of proof-and-bestseller content ran alongside festive and product content rather than replacing it.
Results Achieved — Instagram (Primary Account, Dec–Feb)
| Metric | Dec 17–31 (General) | Jan 1–31 (Sankranti) | Feb 1–20 (General) | Dec→Jan | Jan→Feb |
|---|---|---|---|---|---|
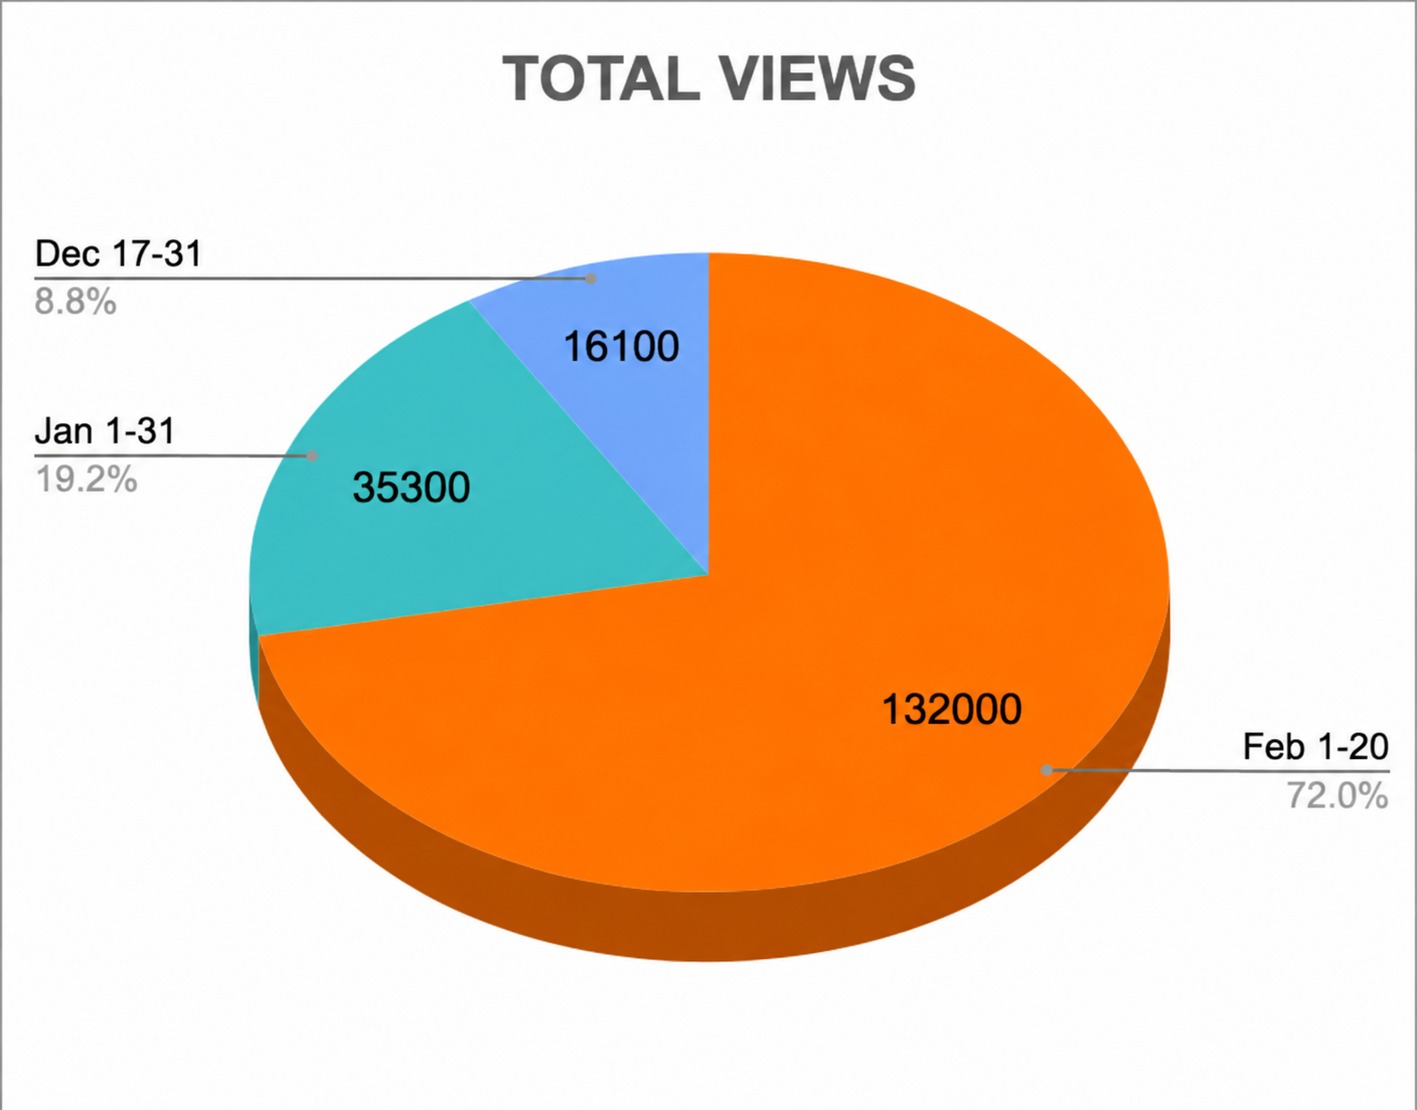
| Total Views | 16,100 | 35,300 | 132,000 | +119.25% | +273.94% |
| Total Reach | 13,800 | 27,400 | 102,500 | +98.55% | +274.09% |
| No. of Stories | 3 | 3 | 8 | 0% | +166.67% |
| No. of Posts | 7 | 18 | 4 | +157.14% | −77.78% |
| Views — Organic | 14,007 | 6,001 | 7,920 | −57.16% | +31.98% |
| Views — Ads | 2,093 | 29,299 | 124,080 | +1,299.86% | +323.50% |
| Influencer Collabs | 0 | 0 | 1 | — | — |
Figures sourced directly from the “3 Months Report IG” tab. The headline “274%” figure refers to the Jan→Feb increase in Total Reach (+274.09%); Total Views grew a near-identical +273.94% over the same month. March, April, and May columns exist in the workbook but were not filled in as of this report, so no data is shown for those months.
Top-performing content
The workbook's “Most Reached Reels” screenshots show which specific posts drove the growth each month:
December
- “From Winter Sweets to the warmth of…” (Dec 28) — 43.5K views, 66 likes
- 2024 Milestones post (105+ 5-star reviews, 21,000+ deliveries) — 216 views
- Top 5 Purchased Products post — 203 views
- New Year post — 451 views, 10 likes
- Christmas post — 226 views, 2 likes
January (Sankranti)
- “Wait…choose! Main stores: Aundh and…” (Jan 21) — 28.6K views, 49 likes
- Til product range post (Jan 12) — 356 views, 6 likes
- Kaju-Strawberry Burfi post (Jan 14) — 284 views, 5 likes
February
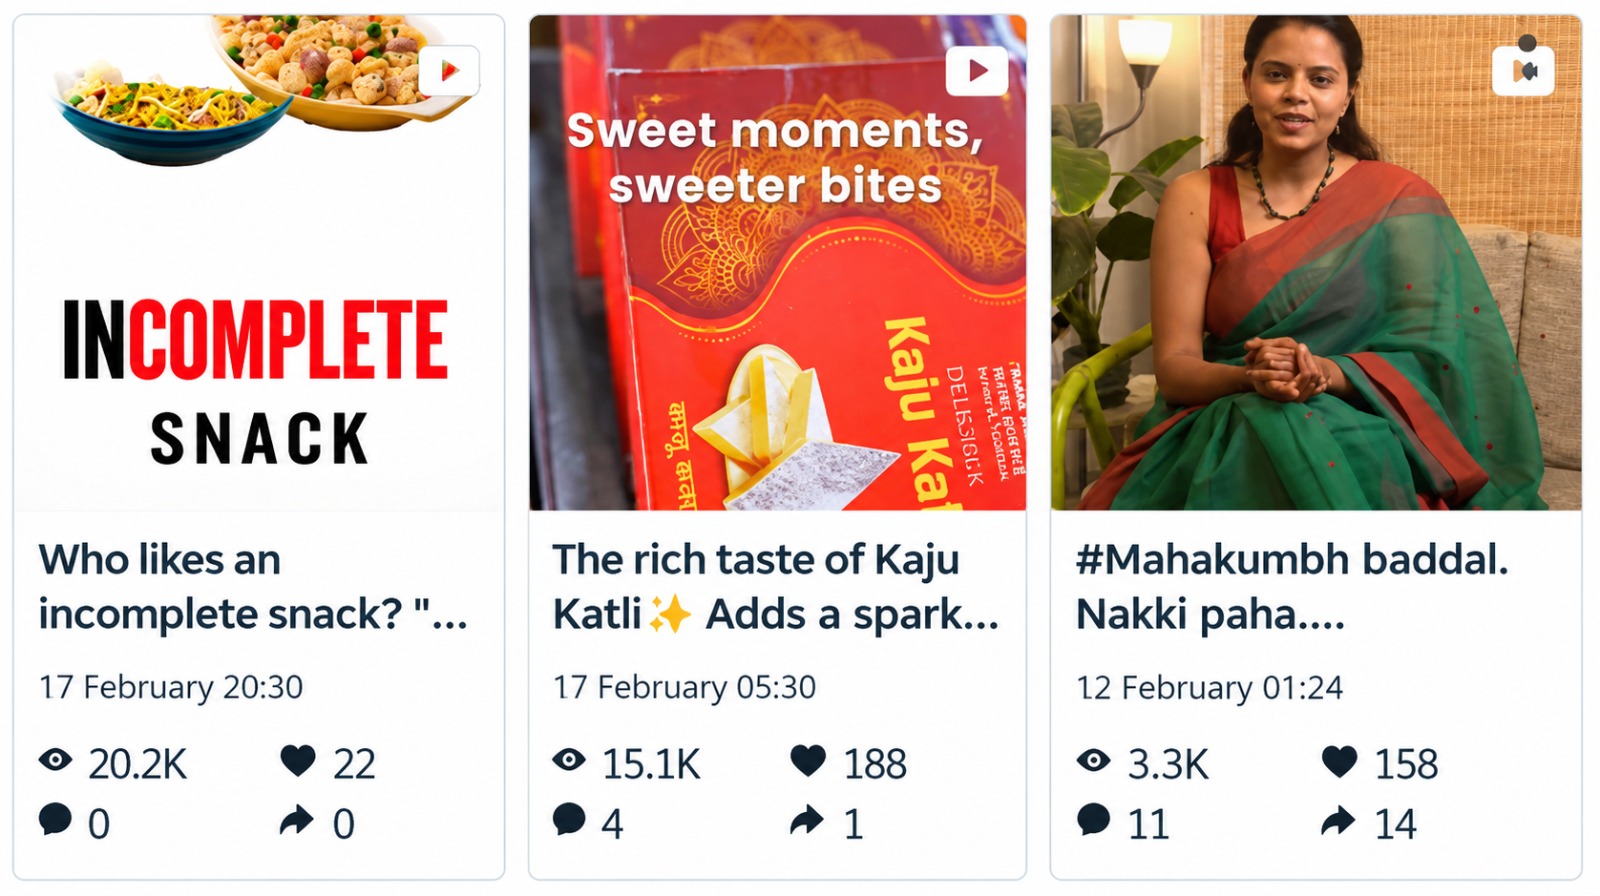
- “Who likes an incomplete snack?” (Feb 17) — 20.2K views, 22 likes
- “The rich taste of Kaju Katli” (Feb 17) — 15.1K views, 188 likes
- “#Mahakumbh baddal. Nakki paha….” (Feb 12) — 3.3K views, 158 likes
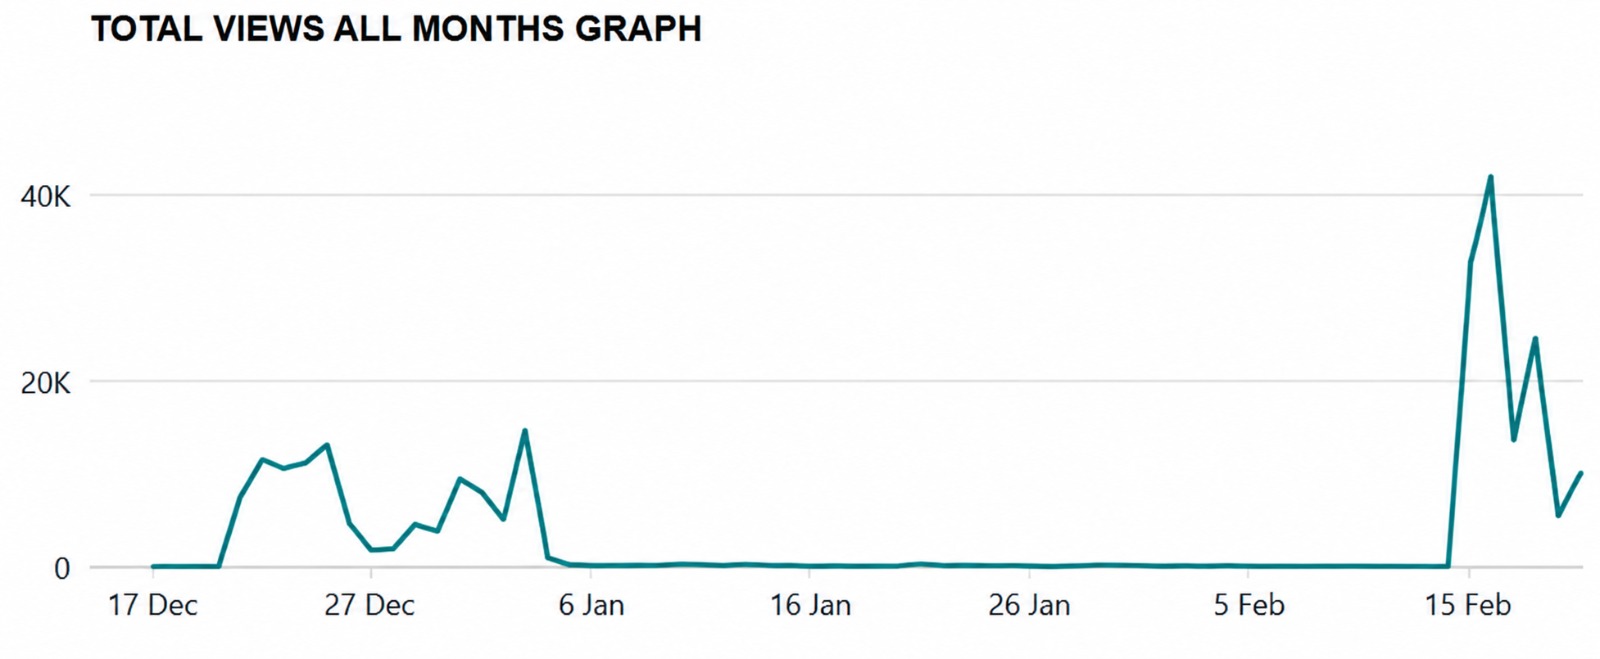
All Months Views Graph — Dec 17 to Feb 20 daily view trend
Supporting Channel Performance
The engagement also tracked Facebook, LinkedIn, and Google Business Profile activity over the same broader window. These are included for full transparency, not folded into the Instagram headline number.
| Metric | Jan 1–31 (Sankranti) | Feb 1–20 (General) | Feb 20–Mar 19 (General) |
|---|---|---|---|
| Total Views | 32,544 | 128,700 | 1,000,000 |
| Total Reach | 914 | 3,100 | 498,900 |
| No. of Stories | 3 | 8 | 22 |
| No. of Posts | 18 | 4 | 9 |
| Views — Organic | 3,905.28 | — | 912 |
| Views — Ads | 28,638.72 | — | 498,541 |
| Influencer Collabs | 0 | 0 | 0 |
Figures sourced from the “3 Months Report FB” tab. Organic/Ads view splits were blank in the source for February. A separate “Facebook” tab in the same workbook lists different December/January view figures (81,000 and 32,600 respectively) under an apparently duplicated layout; both are disclosed here rather than merged, since it's unclear which set supersedes the other — worth clarifying with whoever maintains the sheet before publishing.
| Metric | Company Page (Kaka Halwai Sweets and Namkeens) | Personal Page (Makarand Gadve) |
|---|---|---|
| Impressions | 660 | 799 |
| No. of Posts | 27 | 4 |
| Followers | 202 | 315 |
| Profile Views | 56 | 86 |
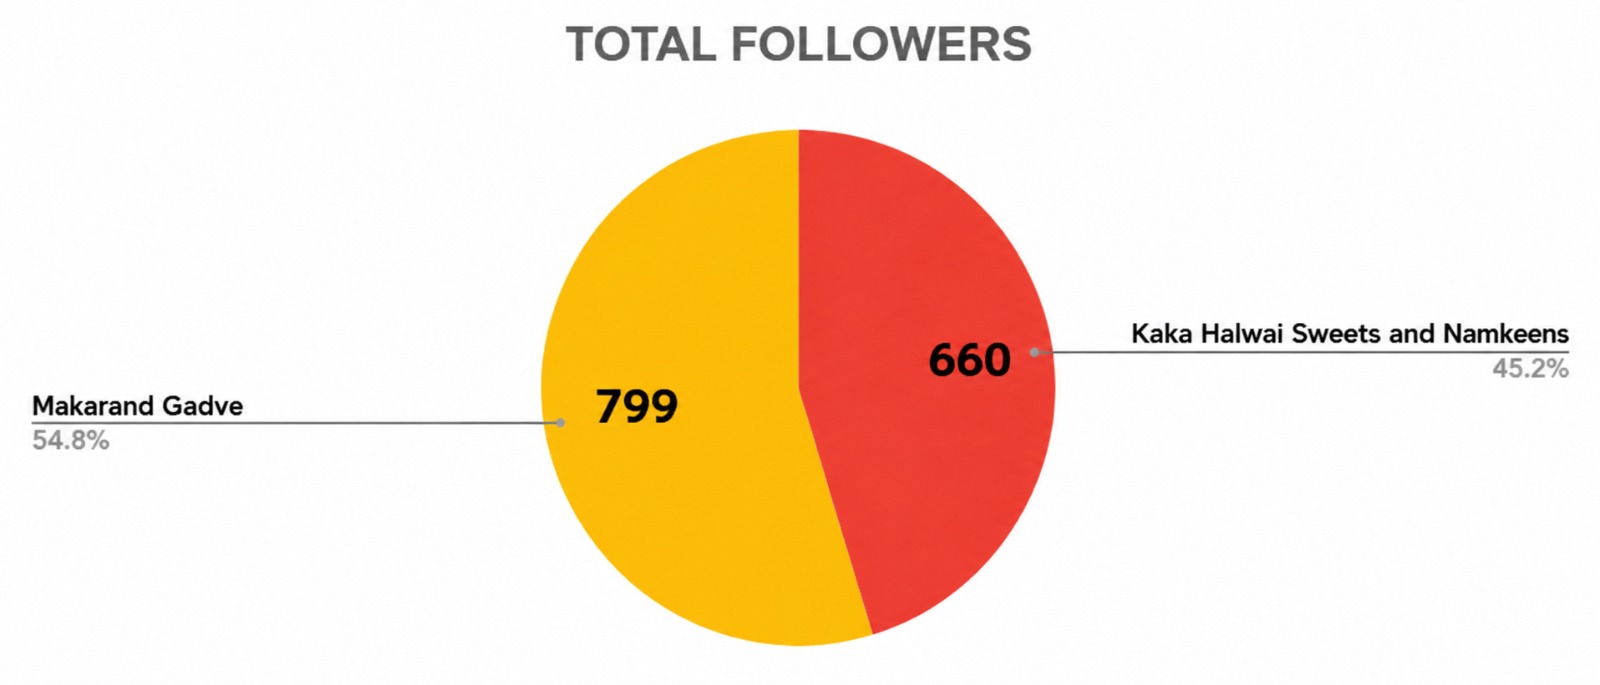
LinkedIn Total Followers Growth — company page vs. personal page
Google Business Profile (local search visibility)
This is the closest equivalent in the source data to “rankings” — it reflects how often the business profile surfaced in Google Search/Maps, not website keyword rankings, since no Search Console or website analytics data was included in this workbook.
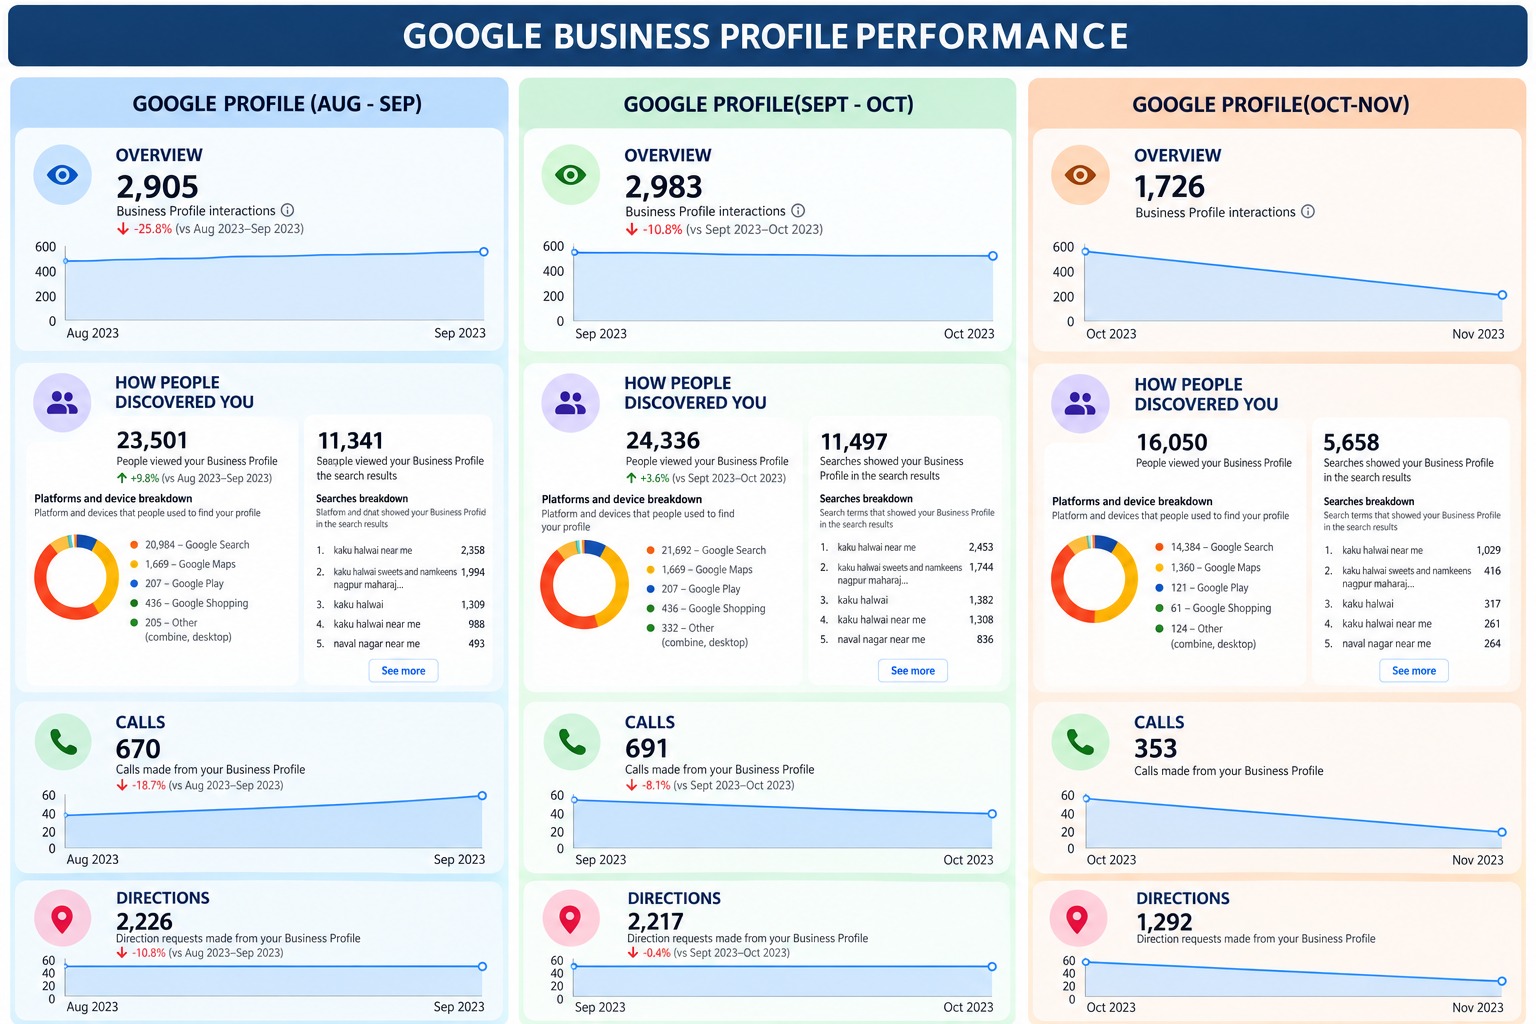
Google Business Profile Performance — Aug–Sept, Sept–Oct, and Oct–Nov 2024
| Metric | Aug–Sept 2024 | Sept–Oct 2024 | Oct–Nov 2024 |
|---|---|---|---|
| Business Profile interactions | 2,905 (−22.8% YoY) | 2,983 (−13.8% YoY) | 1,726 |
| People who viewed profile | 23,501 (+15.4% YoY) | 24,336 (+36.2% YoY) | 16,050 |
| Searches showing profile | 11,341 (+1.5% YoY) | 11,497 (+20.5% YoY) | 5,658 |
| Calls made | 670 (−13.4% YoY) | 691 (−0.7% YoY) | 353 |
| Direction requests | 2,226 (−23.0% YoY) | 2,217 (−18.3% YoY) | 1,292 |
Top search terms surfacing the profile (Aug–Sept 2024): “kaka halwai near me” (2,225), “kaka halwai sweets and namkeen, raagdari society…” (1,254), “kaka halwai” (1,088), “kaka halwai sweet center” (950), “sweet shop near me” (491). The same five terms led in the Sept–Oct and Oct–Nov windows, at gradually declining volumes. Across all three periods, roughly 56–59% of profile discovery came via Google Search on mobile and 33–35% via Google Maps on mobile.
Note: Oct–Nov 2024 figures had no year-over-year comparison available in the source screenshots.
FAQ
What does the “274%” figure refer to?
Was this growth organic or paid?
What was the Sankranti campaign?
Does this case study include SEO rankings or CTR?
How was this data verified?
Looking for Social Growth for Your Food & Sweets Brand?
If your business is in FMCG, sweets & namkeen, D2C food, or retail, Brew & Buzz helps brands scale through: