
How Brew & Buzz Rebuilt Mango Estate’s Meta Ads Lead Funnel — and Why Cost Per Lead Went Up on Purpose
A Pune land-plotting campaign was pulling high lead volume at a low cost — but the sales team was drowning in junk form-fills. Here’s what changed when Brew & Buzz took over targeting, CRM, and creative testing in July 2026.
Data verified as of Aug 12, 2026 — sourced directly from Meta Ads ManagerKey Takeaways
Sales-reported spam reduction: ~90%. Mango Estate’s sales team told Brew & Buzz that junk/low-intent leads dropped by around 90% after the July 2026 changeover — a self-reported figure, not one pulled from an audited spam-scoring tool.
The channel mix flipped — Facebook’s share of leads fell from 66.9% to 32.3%, while Instagram rose from 33.1% to 67.7%, after targeting and demographic filters were rebuilt.
Cost per lead rose from ₹84.33 to ₹217.27 — a deliberate trade-off, not a missed target: fewer, better-qualified leads at a higher CPL rather than high-volume junk at a low one.
Total lead volume dropped from 353 to 96 across the two comparable windows, consistent with a campaign that was cutting spam rather than chasing raw form-fill counts.
Weekly creative testing cadence replaced a static, unrefreshed ad set — new creative was tested roughly every 7 days after the takeover.
About the Client
The Mango Properties (Mango Buildcon Pvt. Ltd.) is a Pune-based real estate developer selling land plots in Velhe, marketed through Meta Ads campaigns under names including “Silva Plotting” and “Mango Estate.” Plot pricing bands referenced in the campaign data range from roughly ₹6L–₹25L+, sold primarily to buyers in and around Pune.
The Problem: High Lead Volume, Low Lead Quality
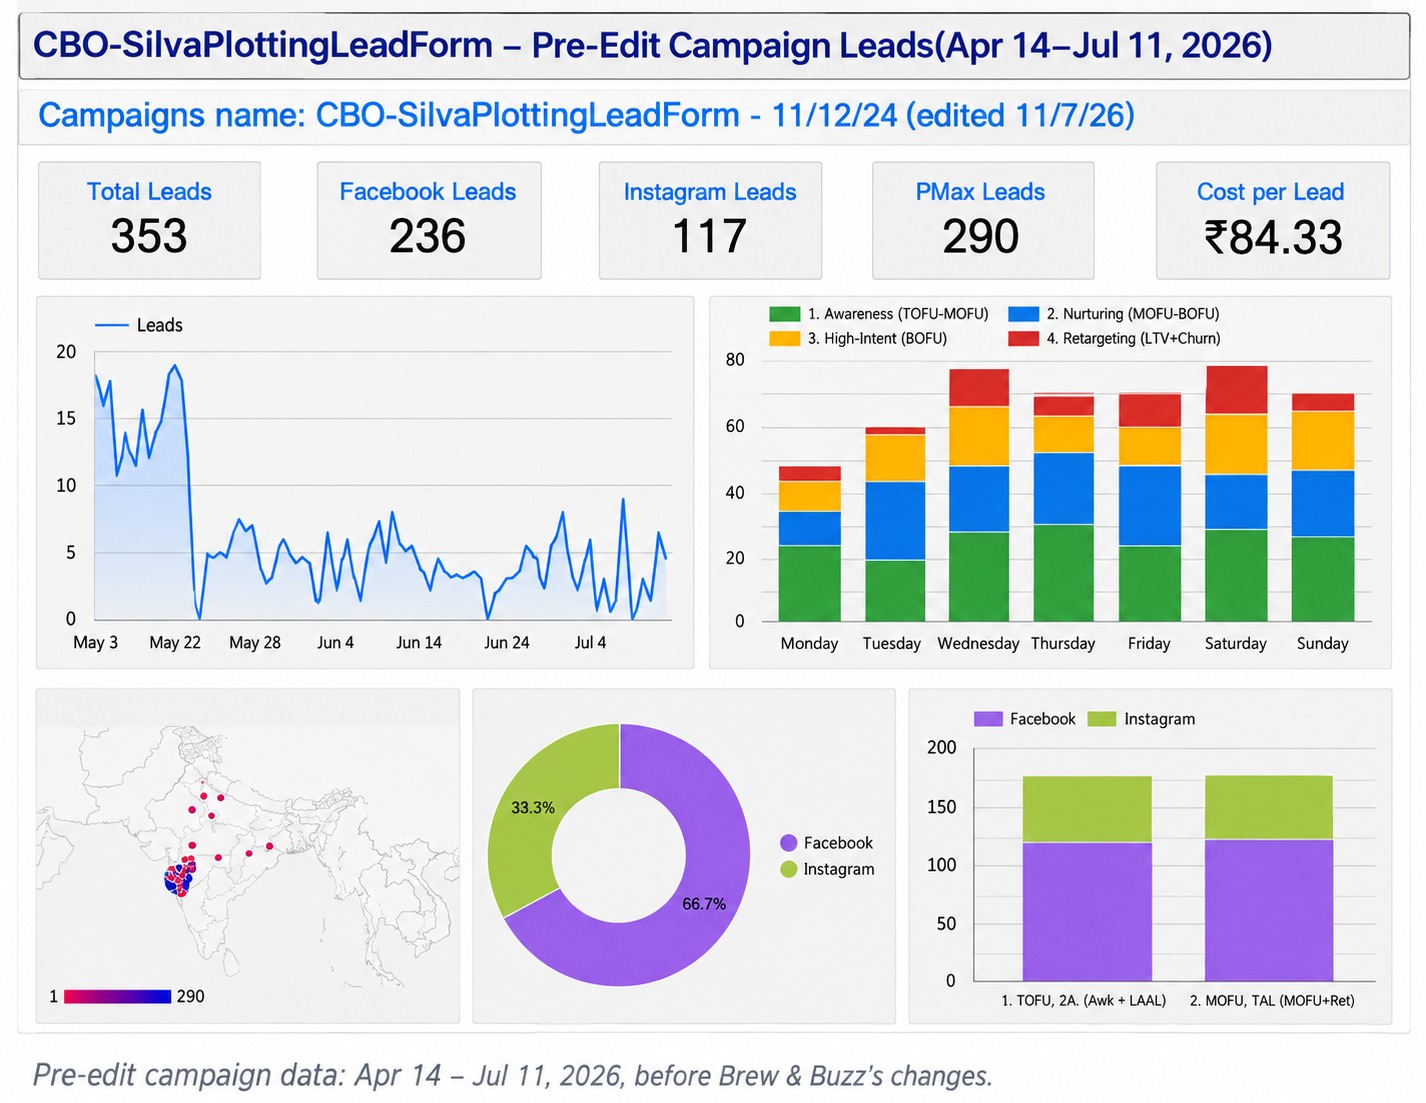
Before Brew & Buzz took over in July 2026, the CBO-SilvaPlottingLeadForm campaign — a CBO (Campaign Budget Optimization, Meta’s system for automatically distributing budget across ad sets) structure running since December 2024 — was generating a large volume of leads at a relatively low cost. All leads referenced in this case study come from Meta Lead Ads (native on-platform lead forms, logged as “Leads (Form)” in Ads Manager), not website form conversions.
The sales team flagged a growing share of those leads as spam or low-intent. Two-thirds of leads were coming from Facebook at a cost of ₹84.33 per lead, a combination that, in land-plotting lead gen, often correlates with cheap, low-effort form-fills rather than genuine plot buyers.
For context: industry benchmark aggregators (PaidMediaWorld, WeBuildReach, Sotros Infotech; 2026 data) put typical Meta Lead Ads CPL for Indian real estate somewhere in the ₹200–₹900 range, with tighter, higher-intent targeting pushing toward the top of that band. These figures vary a lot between sources and aren’t independently audited, but they’re useful directionally: the pre-edit ₹84.33 CPL sat well below even the low end of most published ranges — a pattern that, on its own, is often a red flag for low-quality traffic rather than a genuine efficiency win.
Our Approach: What Changed in July 2026
Brew & Buzz took over the account and rebuilt the funnel across four areas simultaneously:
- Audience rebuild — targeting and demographic filters were reworked from the ground up rather than adjusted incrementally.
- CRM integration — the ad account was connected to the client’s CRM, so leads could be tracked and qualified past the point of form-fill.
- Content and graphics overhaul — ad creative and messaging were rebuilt rather than reused.
- Weekly creative testing — new creative variants were tested on a roughly 7-day cadence going forward, replacing a static ad set.
- One platform dominates more than 60% of leads. Here, Facebook made up 66.9% of leads pre-edit — a concentration that often means the algorithm found the cheapest audience to satisfy the objective, not the most qualified one.
- CPL sits meaningfully below the category benchmark. ₹84.33 was below most published 2026 ranges for Indian real estate Meta Lead Ads (roughly ₹200–₹900) — a gap worth investigating rather than celebrating.
- Sales can’t convert what marketing delivers. The clearest signal here: the client’s own sales team flagged rising junk leads before any dashboard number did.
Filtering out low-cost, low-intent traffic (largely the cheap Facebook form-fills that made up two-thirds of leads pre-edit) almost always raises blended CPL in the short term, because the remaining leads are harder-won. The number that matters more here is what happens downstream — genuine inquiries and site visits — which is the number the sales team’s 90% figure is describing, even though it isn’t captured in the Meta Ads dashboard itself.
The Data: Before vs. After
Comparing the two Meta Ads Manager windows directly on either side of the July 2026 changeover:
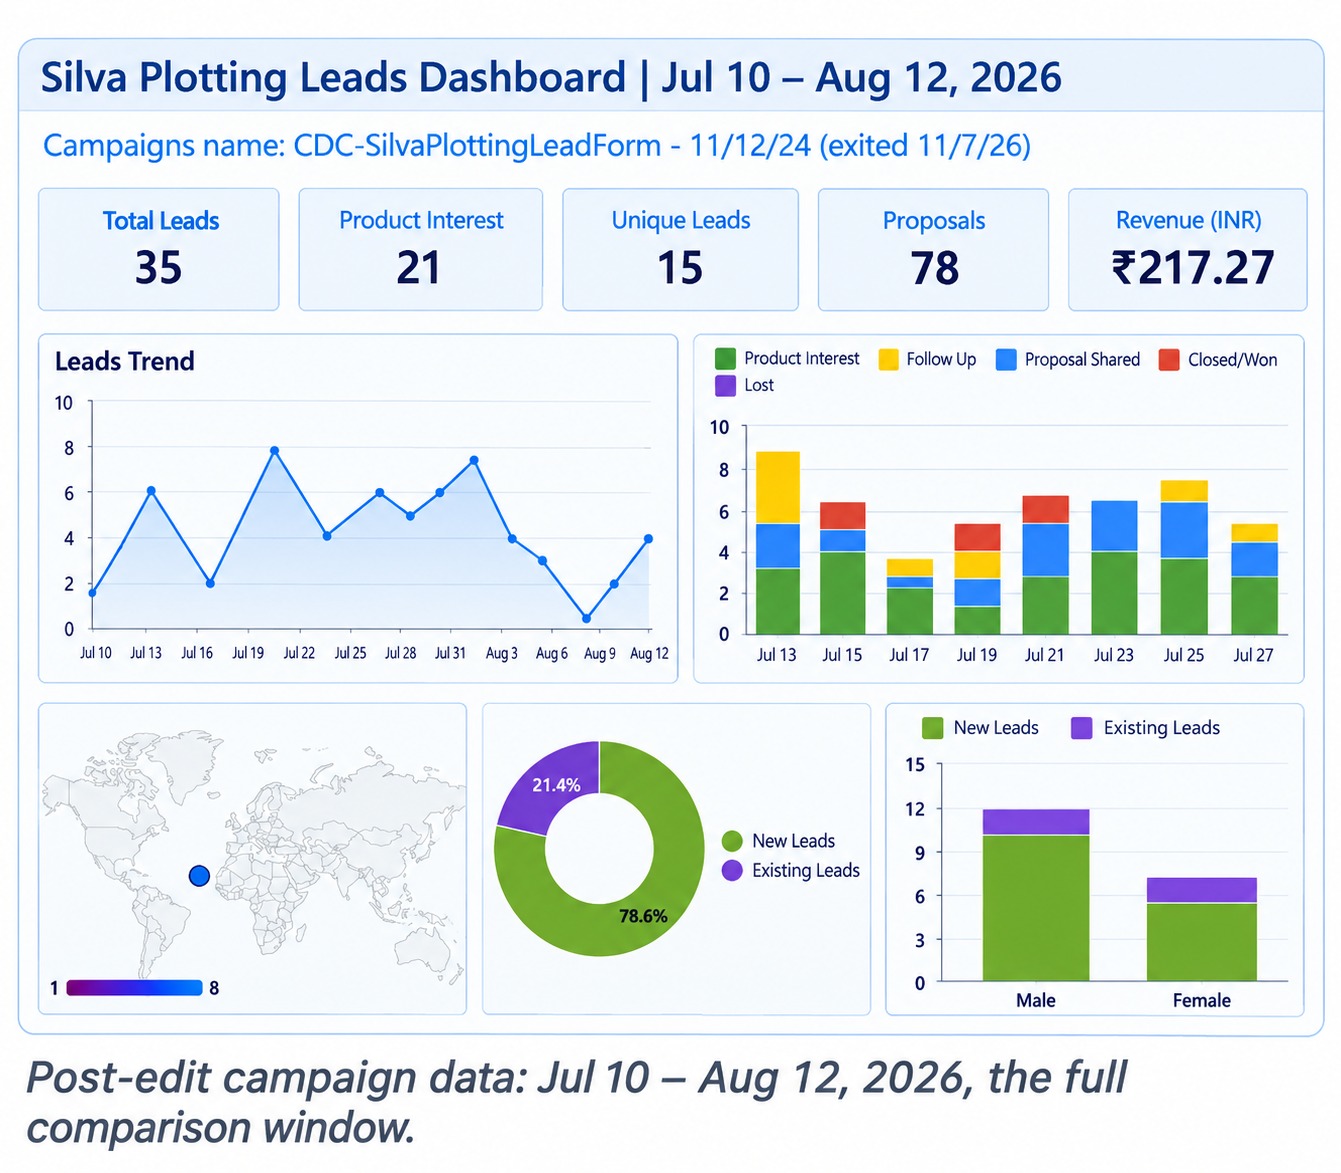
| Metric | Pre-edit (Apr 14–Jul 11) | Post-edit (Jul 10–Aug 12) | Change |
|---|---|---|---|
| Total leads | 353 | 96 | −73% |
| Facebook leads | 236 (66.9%) | 31 (32.3%) | Share cut in half |
| Instagram leads | 117 (33.1%) | 65 (67.7%) | Share roughly doubled |
| Pune-based leads | 290 | 76 | −74% |
| Cost per lead | ₹84.33 | ₹217.27 | +158% |
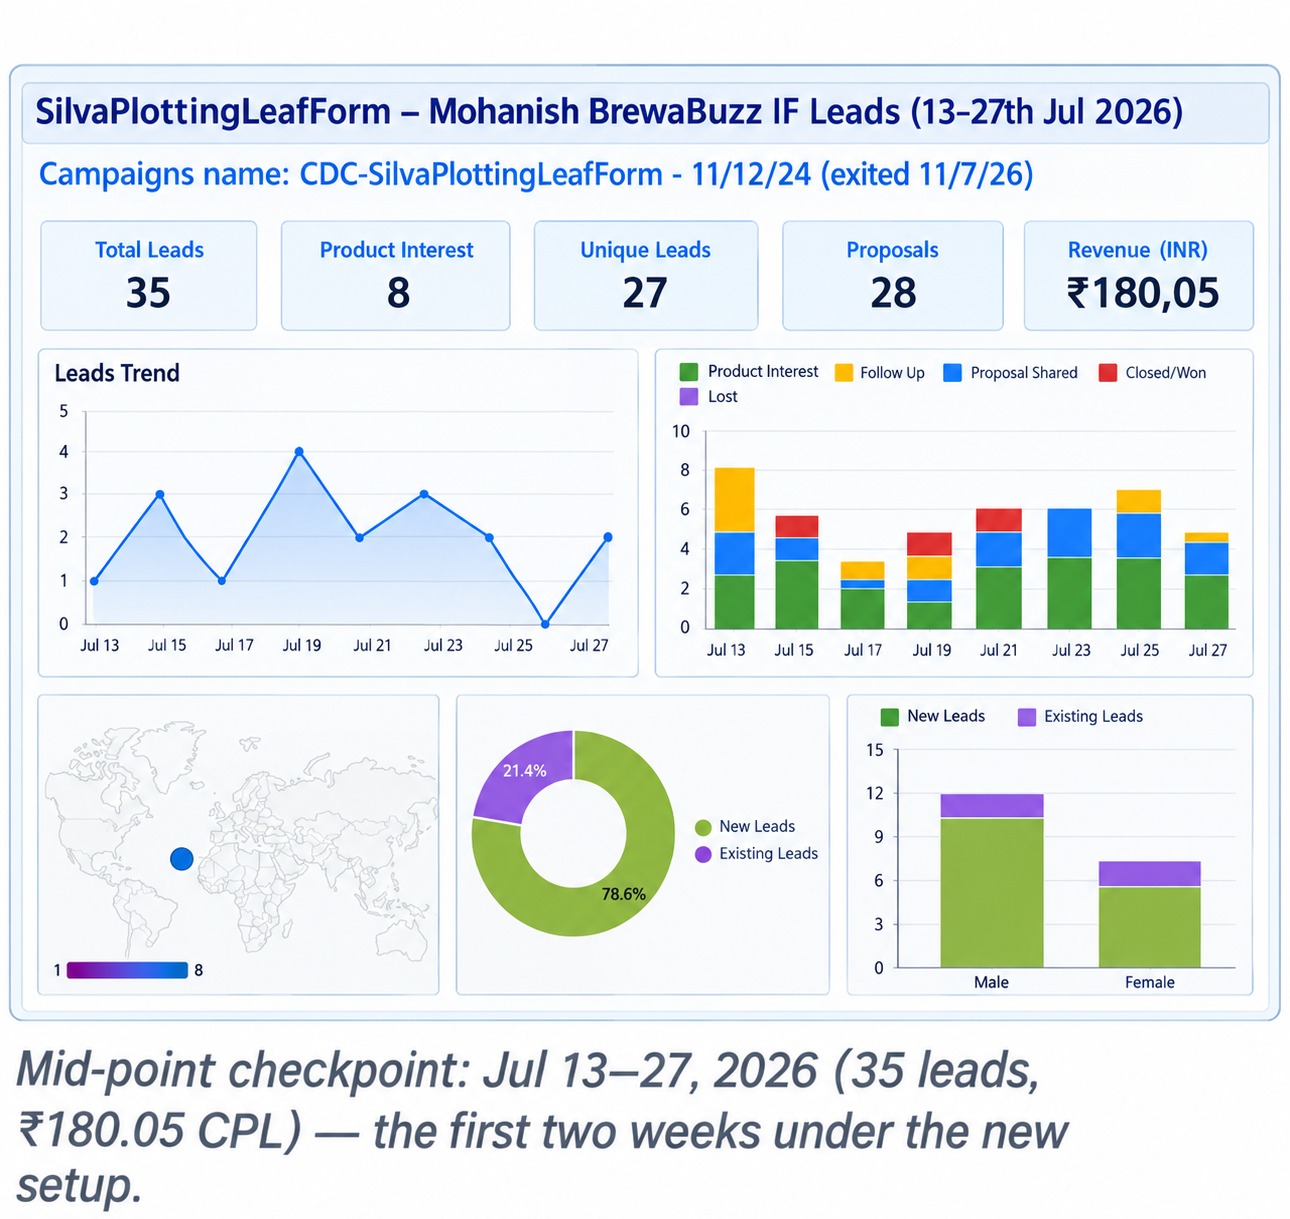
Mid-point checkpoint: Jul 13–27, 2026 (35 leads, ₹180.05 CPL) — the first two weeks under the new setup. Post-edit campaign data spans Jul 10 – Aug 12, 2026, the full comparison window.
Running Alongside: The Mango Estate Video Ad Campaign
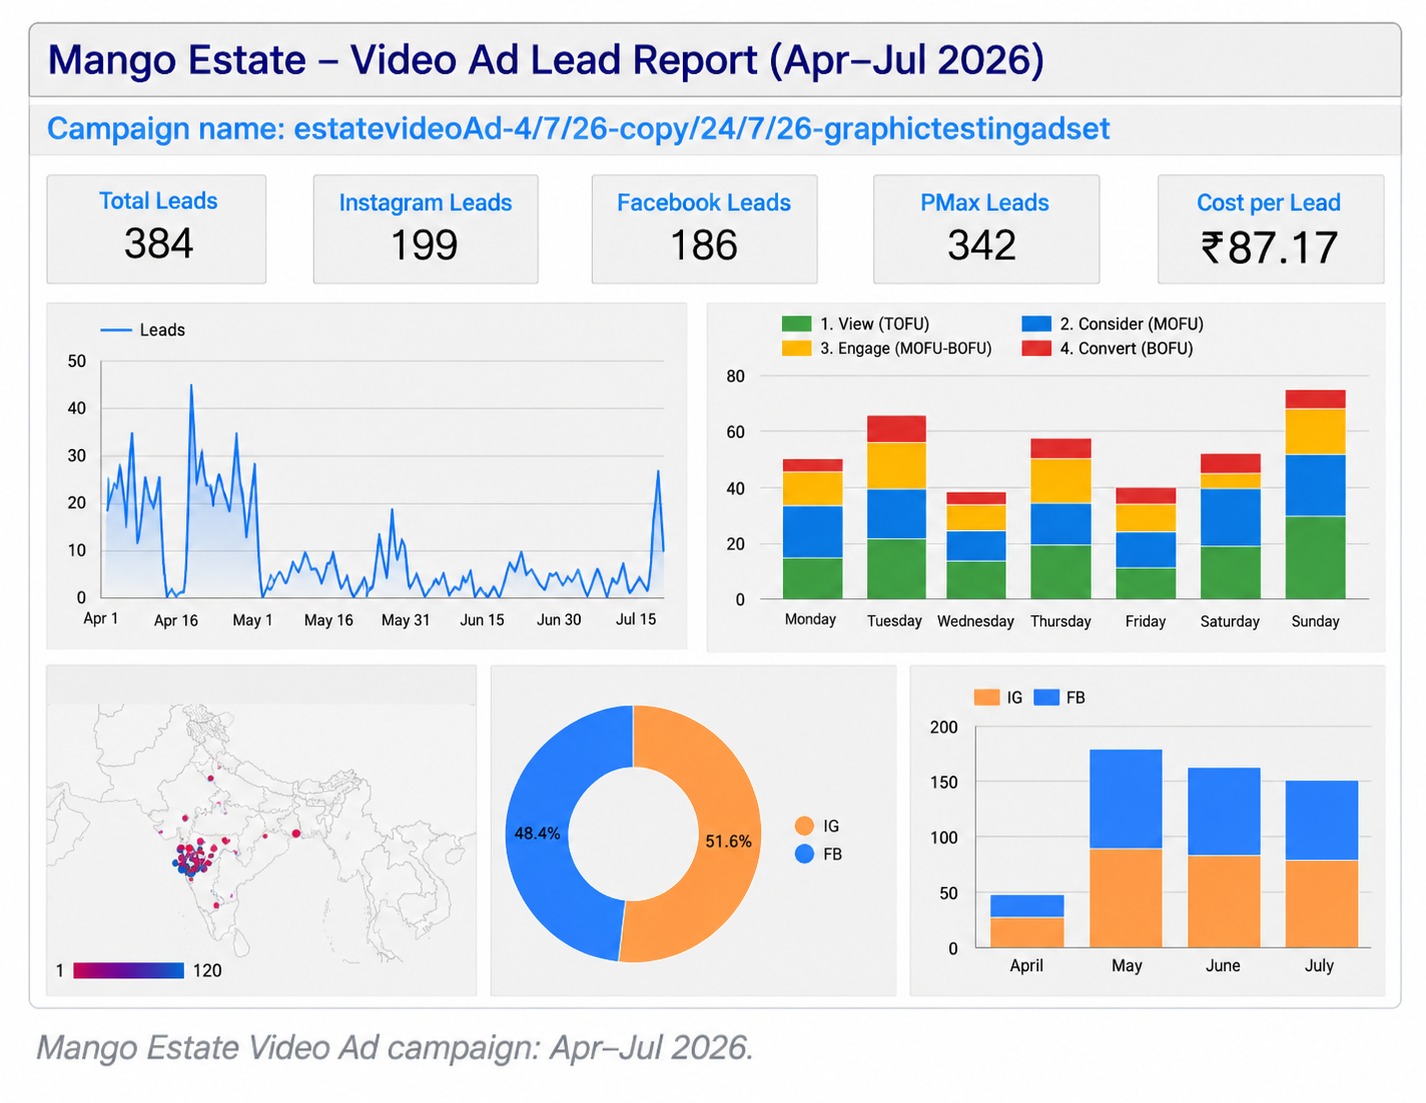
A separate campaign — “Mango Estate – Video Ad Lead Report,” running April–July 2026 — generated 384 total leads at ₹87.17 cost per lead, with a near-even 51.6% Facebook / 48.4% Instagram split and 342 of the 384 leads based in Pune. This campaign isn’t part of the before/after spam-reduction comparison above since it uses different creative and ran on an overlapping but distinct timeline — but it’s useful context: it shows the account can sustain high lead volume at a reasonable CPL when the goal is broad-funnel awareness rather than the tightly-qualified plot-buyer targeting used in the Silva Plotting campaign.
What Made the Strategy Work
Rebuilding the Audience From Scratch
Rather than trimming the existing audience, targeting and demographic filters were rebuilt entirely — the kind of change that shows up as a channel-mix shift (Facebook down, Instagram up) rather than a small dip in spend.
Connecting the CRM
Linking the ad account to the client’s CRM meant leads could be tracked past the point of form submission, giving the sales team a way to flag genuine inquiries versus junk — the operational change behind the reported 90% figure.
Weekly Creative Refresh
Testing new creative roughly every week kept the ad set from going stale, a likely contributor to the improved lead relevance seen in the post-edit window.
Frequently Asked Questions
When did Brew & Buzz take over this account?
Why did cost per lead go up after the changes?
Is the 90% spam reduction figure verified?
What industries does this approach apply to?
Running a High-Ticket Lead Gen Campaign With a Spam Problem?
If your Meta Ads are pulling volume but your sales team is drowning in junk leads, Brew & Buzz helps businesses fix the funnel through: